“In the life of every business process or A/B experiment, there comes a moment when it is time to analyze its results and understand whether we made this or that business decision for a reason.”
Hi all! The WooBeWoo team is in touch – and we have great news for users of the most popular Woocommerce filtering plugin on WordPress, WooBeWoo Product Filter.
We are introducing a new feature “Filter Statistics”, and now you can get invaluable data about the behavior of your store customers to use it for analysis and subsequently create truly effective business strategies and decisions based on these metrics.

In this article, we will talk about what features are available in the new section and why it can be a decisive factor in your business.
Why are metrics important?
Typically, all business decisions are made based on the balance of two opposing and mutually reinforcing forces: analytics vs intuition. Analytical thinking and intuition are usually opposed to each other. However, according to American expert Joshua Reynolds, director of marketing at Quantifind, the most effective decisions can only be made based on both of these perceptions.

Our intuition is only partly correct: after all, intuition is an expected decision, based on a hypothesis that works only in our head, with vague facts, and lived experience. It is not clear how to evaluate the solution.
At the same time, the goal of analytics is to make a management decision. By analyzing the data, you can identify, for example, a certain pattern, an unmet need of the buyer, or a persistent search for a particular product, so that later you can try to scale this data and send it to business decisions.
That is why we have added the ability to track the actions of your users in the “heart of your site” – in the product filter. After all, it is to the product filter that the user speaks about his desires, indicating the parameters that the product he so desires should have.
From a seller’s point of view, this is just a great decision-making tool, because it is much more efficient to make business decisions based on reliable data, and not on guesswork.
What metrics are available with the new Statistics feature?
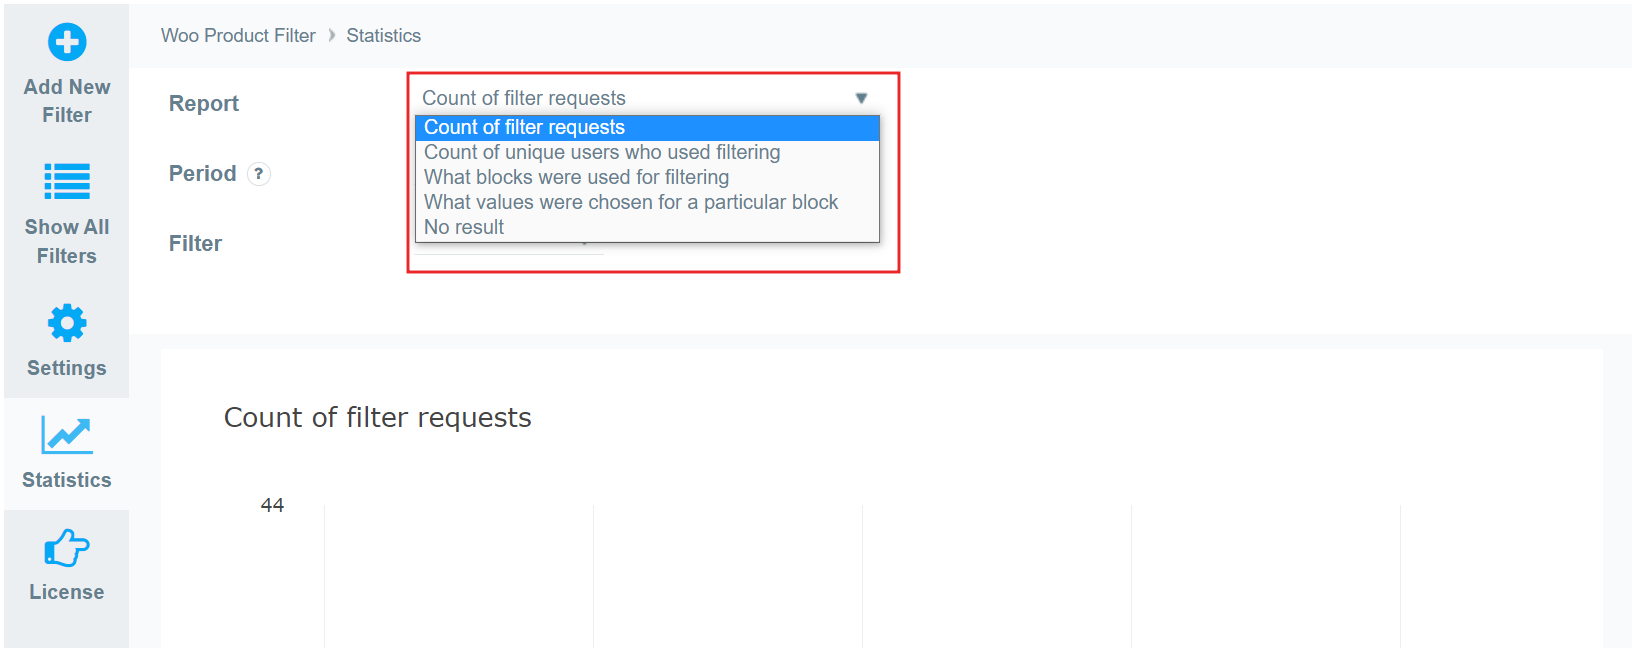
The update adds the following metrics to the statistics section.
- Count of filter requests.
- Count of unique users who used filtering.
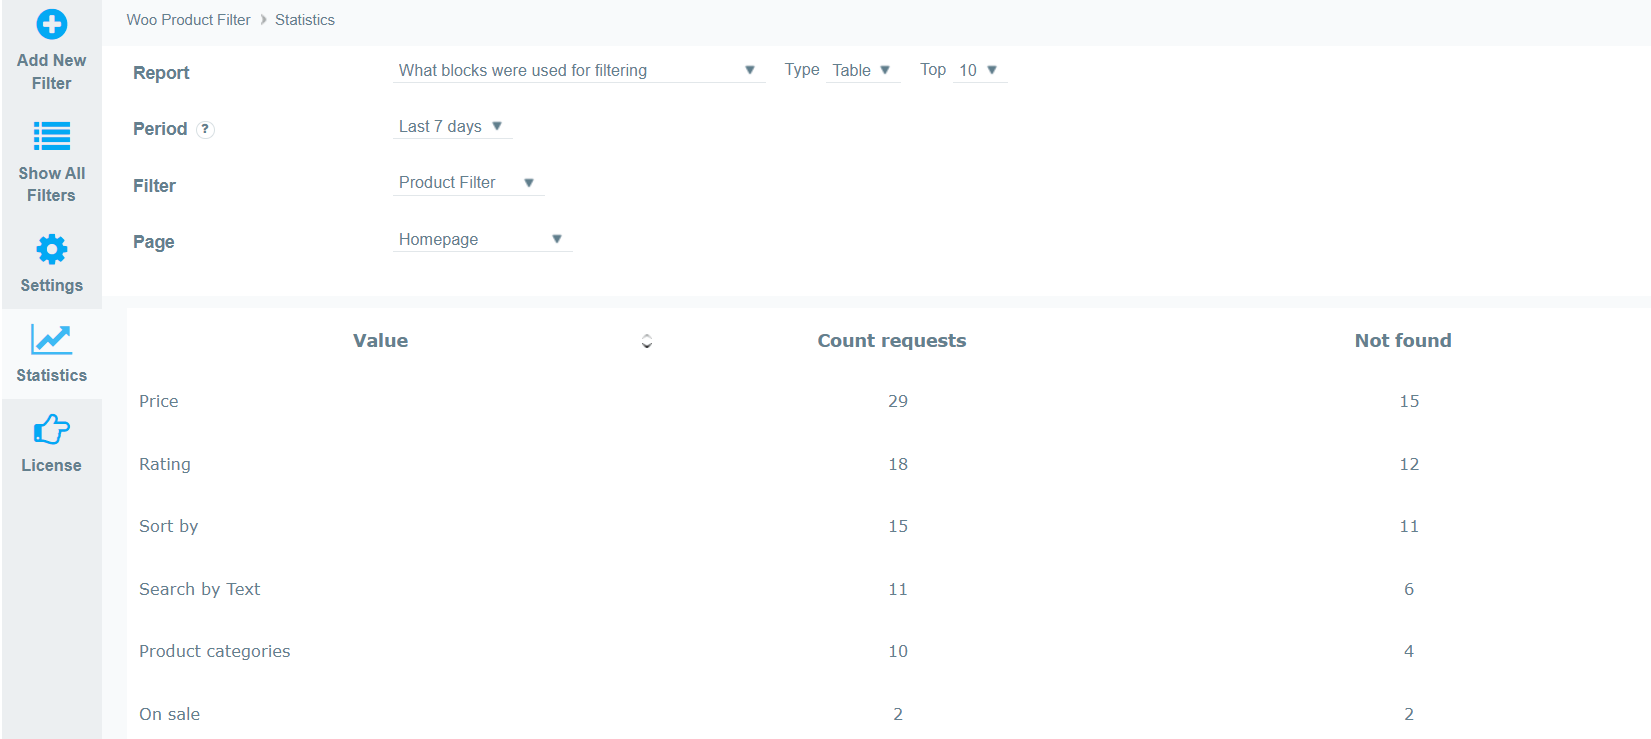
- What blocks were used for filtering.
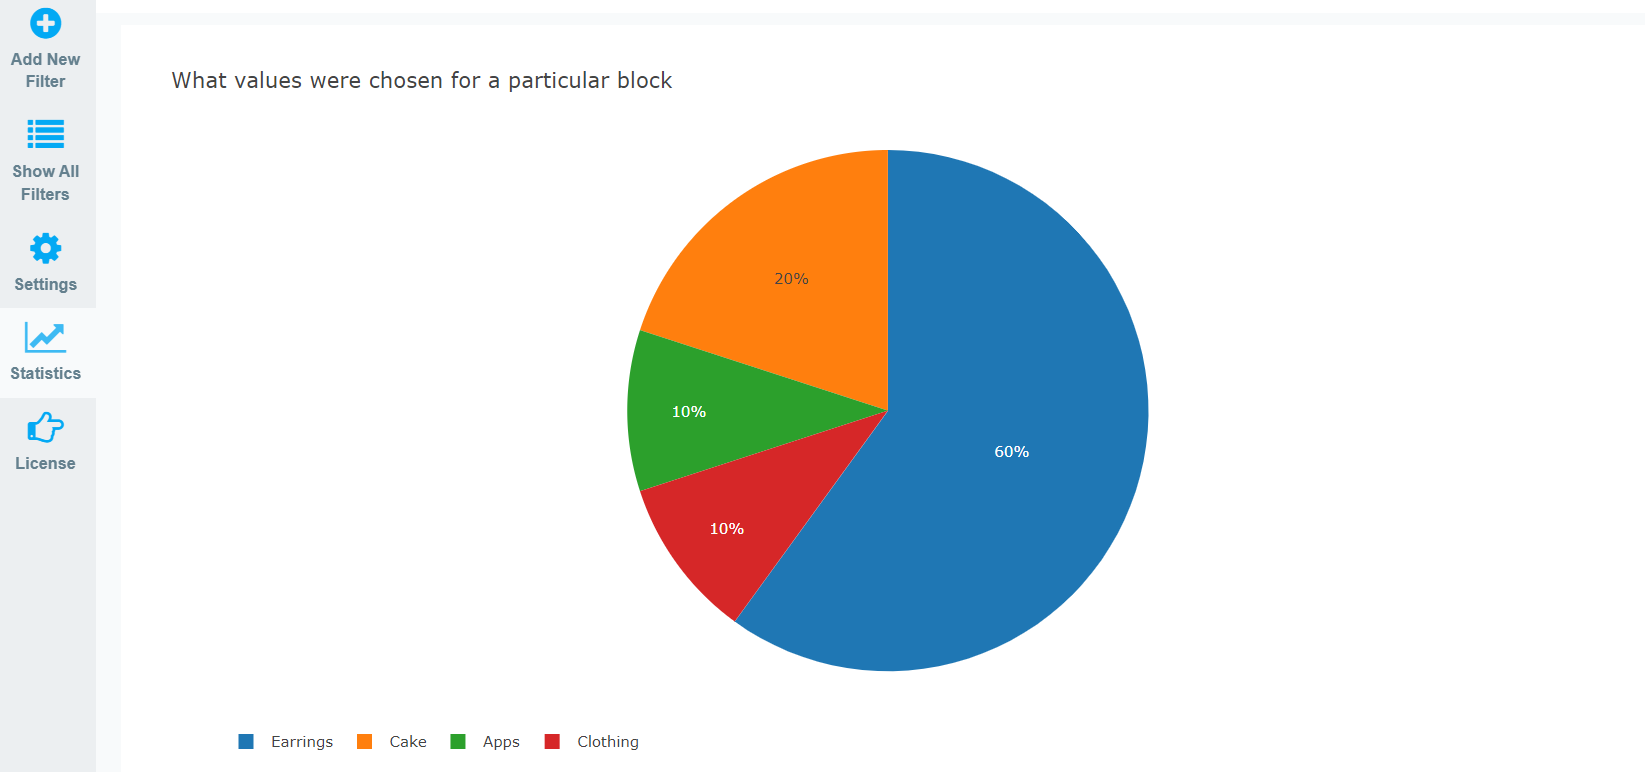
- What values were chosen for a particular block.
- No result.

At the same time, you can choose the TYPE of chart for statistics visualization, as well as any period for tracking.
Each filter can be explored individually, providing incredible opportunities for A/B testing
Moreover, you can track the filtering for EACH page separately.
But still, we have a blog article here, if you want to learn more about customization, study this documentation article.
How can this data be used effectively?
There is no perfect algorithm for making decisions, but there are tools that make such decisions easier and more efficient.
First of all, filtering statistics are designed to suggest what products users want to see in your store, what parameters the products they are looking for should have, what filters are effective, what products are not needed / not profitable in your store, what price users charge for a particular product, and many more. combinations that can be calculated using filtering statistics.

There are thousands of such examples of situations, but we wanted to show exactly the logic of how statistics can make your business more efficient and customer-oriented.

Therefore, experiment, test, and make an informed management business decision, and the statistics of the best product filter for WooCoommercee – WooBeWoo will always help you with the data!